
[This is an update of a popular post written by Ryan Skinner a few years back. We wanted to add a bit more value, linking to new examples and making new suggestions. Hope you like it! If you do, you may also like our whole content marketing agency site. And these posts on infographics in marketing:]
The Client and the Infographic – an interview with SignalNoise.
Data Comes From Anywhere – an interview with Jer Thorp data artist
Six Infographics That Our Designers Love – some wonderful ones here
What’s A B2B Infographic? – some tough questions.
Lots of information to share? Making an infographic? Here are 14 ways to visually organize your information, with examples and tips on when to use them.
There are two ways to discover the best way to go about presenting information or a story visually:
- Get to know your data or story intimately. Rake your zen garden, and ask yourself “what does my data want to look like?”
- Go through hundreds of infographics and try to see if any of the better ones are a good fit for what you want to do, or say.
For this post, I’ve tried to do the latter for you (if you want to cultivate your zen garden, I can’t do anything for you).
The process:
I went to Visual.ly (an excellent source for infographics, and the community around them) and reviewed a couple hundred of the most popular infographics by pageviews. This trawl revealed 14 visual metaphors. Here I’ll share them, and answer a few questions for each:
When does a particular visual approach really work?
What’s worthwhile keeping in mind, from a design perspective?
What are a few good examples?
The 10 + 4 Visual Conceits
Anatomy

An anatomy visual or infographic provides an annotated exploration of the contents of a large and complicated object or idea. It can either be metaphorical (like the “Anatomy of an SEO” infographic below) or straight (like the “Anatomy of a Perfect Website” infographic below).
When do you use it? Any time you want to educate about something with many moving constituent parts, which are not widely or easily understood.
Design notes: Although our goal is to illustrate and elucidate complexity, you need to resist the temptation to get too detailed and explicit.
Some examples: SEOMoz Anatomy of a Search Marketer, Anatomy of a Perfect Website, The delightful Imaginary Factory series by Jing Zhang and The Brain of a Beginner Blogger by Infolinks.
Timeline

These are great to demonstrate (or create) a series of cause and effect relationships, or evolution.
When do you use it? Whenever change over time is your main point
Design notes: Do you start late and work backwards or do you start early and work forwards? Generally the latter, unless the point you’re trying to make concerns the historical roots of something. Pay attention to time scale – try to conserve gaps and bunches.
Examples: Battlefield vs. Call of Duty Timeline and The Inception Timeline (hint: it ain’t straight)
Timeline Sub-genres:
History of… example: History of Alarm Clocks
Evolution of…example: The Evolution of the Geek
Taxonomy

Like this post, we all try to classify things. Somehow bucketizing stuff puts our chimp minds at ease. It also allows you to communicate breadth AND depth.
When do you use it? If you want to clarify significant and recognizable differences between sub-groups
Design notes: Use this only if you have multiple elements that differ on many different axes (if you have only two things, you may want to use side-by-side comparison (below); if only one axis, maybe scale (below))
Examples: Nuts & Bolts of Chart Types and a new favourite: The Magnificent Multitude of Beer by PopCharts Labs and their 200 Super Powers chart.
Taxonomy Sub-genres:
Periodic Table example: The Periodic Table of SEO Ranking Factors, The Periodic Table of Swearing
Tree example: Eloqua Blog Tree
Map

Maps are fucking great. I love them. You can find out where you are, where you’re going and where…other stuff is. Nothing provides spatial and conceptual context quite like a map.
When do you use it? Whenever you want to communicate proximity, distance and direction between a number of different items, or data points.
Design notes: If you can pack significance into the layout of your map (that is, distances, objects and sizes all have meaning), the better it’ll be.
Some examples: Flowtown Social Networking Map, The Creative Process Map and The amazing, interactive Distance To Mars demonstration by David Paliwoda and Jesse Williams.
Enjoying the post? I hope you’ll share it with like-minded people. Tweet it. LinkedIn share. Or like it.
Chutes and ladders

You know the game – you jump forward and slide backwards seemingly by chance, always struggling from start to finish. Participants proceed through one-part design and one-part chance.
When do you use it? When you want to explain a process, wherein pretty much everyone wants to start and end at the same place (but the route from start to finish is highly variable)
Design notes: Generally there’s little debate about the steps along the way; spend your time and effort on the leaps forward and backwards, because those will draw the most attention.
Examples: Credit Report 101 and Marketing Chutes and Ladders by Insightera.
Space equals space

It’s one of the first lessons from nursery school: some things are big, other things are little (but only compared to each other). The space equals space infographic plots two or more things against each other using the same scale.
When do you use it? Whenever you want to communicate the relative size or number of disparate things, because the relationship is unexpected or interesting
Design notes: Often it’s great to set a baseline, then compare and contrast with that. Changing the baseline can be confusing.
An example: What’s Smaller Than Apple and How Big Are the Game of Thrones Dragons.
Scale

Everything in the universe, no matter how unique, is on a sliding scale – we must just ask ourselves what the scale is. For example, a pink unicorn is on a sliding scale from “is a pink unicorn” to “is not a pink unicorn” where most things in the universe are towards the endpoint of the second group.
When do you use it? Anytime you want to prioritize or rank a number of objects against a criterium that your audience will particularly like
Design notes: Top-down scales will tend to make the top look good, and bottom bad; side to side rankings will not give one end of the scale preference.
Some examples: The Likability of Angry Birds, The Trustworthiness of Beards
Side by side comparison

We all know the basics of this visual from the classic feature table. You start by selecting a model or example on the top, then you go down the chart to see what that model does or does not have. The point of these is easy comparison.
When do you use it? Whenever you have a limited amount of items that you want to compare or contrast quickly.
Design notes: When you go down to two elements, these elements will often end up looking like they are in conflict.
An example: Geek vs. Hipster
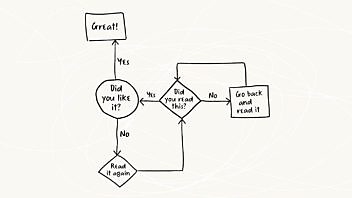
Decision tree

These can be fantastic when they are straight, and these can be fantastic when they are comic. They are designed to answer every possible circumstance with an appropriate answer.
When do you use it? Decision trees are great for guiding people mentally and visually from an indeterminate starting point to any one of many different end-points.
Design notes: You will need to structure each point to have only one or two closed-ended (easy to answer) responses, end with a concrete recommendation and come to a conclusion very quickly.
Some examples: Should I accept that friend request?, Should I wear sweatpants?, Do you have to wake up yet?
Venn Diagram

The Venn diagram comes from the philosopher Rudolf Venn-Herschelderferer who never lost a fight; he just added another layer of complexity. In all honesty, these diagrams are about forcing people into trade-offs. You can’t have it all, have it all pure and have it altogether, ever.
When do you use it? When you want people to see that a situation has no ideal scenario, but rather a series of trade-offs and compromises. Or to show a Sweet Spot where two zones overlap.
Design notes: I’ve never seen a successful Venn diagram with more than max. four big circles. Doesn’t mean it’s not possible, but I’m just sayin’.
An example: How would you like your graphic design?And there’s a great collection of Venn diagrams on this Tumblr: Venn Diagrams Fuck Yeah
Like this post? Share it and we can do more!
Or check out our B2B Content Marketing Strategy Checklist.

Enjoyed this article?
Take part in the discussion


Comments
Unknown April 21st, 2015
This is rediculous! Do you really have to use the F-word. Have you ever thought about how there are little kids on the Internet trying to find a way to present a price of their project????
Alexis Eckhardt January 8th, 2016
Ok dude its just a dang word not an action, kids are just going to learn it when there older so it really doesn’t matter and I’m sure there parents cuss infront of them all the time.
Amy Thoman February 19th, 2019
I also want to use this as a resource for my advanced class of 8th graders who are creating an infographic and this word puts me in a bind. I have to worry about the parents, not the students.
abby May 11th, 2021
im an 11 year old trying to find a way to present my project, and i definitely dont care if the word ‘fuck’ is used. sure, its a cuss word, but who cares? its not the end of the world. <3
https://delicious.com/ July 7th, 2015
Policy issues additionally are plentiful, as producers are hanging around to view whether they
will get certificate or approval for usage by controlled bodies.
The PwC guide kept in mind just how manufacturers will certainly have to re-train their
existing workforce or attract new talent with the skills to look after the 3D-printing manufacturing.
Thirty-seven percent of manufacturers attributed their absence of current know-how in our business to totally manipulate the innovation” as another
great barrier in executing 3DP in their business.
My very first work was in circulation administration with a
business that was a maker.
pooja student January 8th, 2016
woow… ummm yaaah i like it!!! 😀
Meriem Zidane Sister To A Brother And Baby Sister March 28th, 2017
I think the San Pooja!
anomonus April 20th, 2016
niced work, realy like it
Sally sallysalon May 2nd, 2016
I think using puppets to help is the greatest way! 🙂
me me August 22nd, 2016
i need help
jewishfemininust lpujs September 9th, 2016
good job poopin
Doug Kessler September 12th, 2016
I think that’s a good thing. So thanks!
Ez noob November 1st, 2017
Nerd
no you are stupid February 7th, 2017
this was so domb, you suck and your stupid
Doug Kessler March 1st, 2017
I know you are but what am I?
Caitlyn McMunn Agriventures May 4th, 2017
Haha you can’t even spell dumb right, and you used the wrong your. It’s spelled you’re
Elliott N/A June 8th, 2017
well at least he can spell
abby May 11th, 2021
please 💀 it isn’t dumb its actually quite useful, as an 11 year old with a project due in less than a week. its your opinion, but do you really need to should it out for everybody to hear? its straight up annoying.
A guy February 24th, 2017
This sucks 😒
Doug Kessler March 1st, 2017
Don’t make us bring your mother into this, guy.
A guy February 24th, 2017
🖕🖕🖕🖕🖕🖕🖕
Doug Kessler March 1st, 2017
A great example of visual communication. Nice one.
Philippa December 5th, 2017
Lot’s of great info, thank you! I have to put together a presentation on a task force’s findings – which I wasn’t part of – but they want something innovative and creative. Help!
Sandrina April 18th, 2018
Doug is roasting the shit out of everyone. XD
(This page was really helpful, thanks!)
Geoffrey Amodo July 25th, 2018
Ily doug u do u boo
Doug Kessler May 24th, 2021
Thanks, you, Geoffrey. I think.
the man April 18th, 2019
go off doug 🔥🔥🔥🔥🔥🔥🔥🔥🔥
the dude April 18th, 2019
fr 🔥🔥🔥🔥🔥🔥🔥🔥
Tetnis April 18th, 2019
Whoa
Tetnis April 18th, 2019
Whoa
Doug Kessler May 24th, 2021
Worth repeating.
abby May 11th, 2021
this all was really helpful! i skimmed through it and loved it. plus Doug roasting tf out of everybody in the comments just makes it better. it was very helpful, and im probably going to use some of these for my project! tysm <3
Doug Kessler May 24th, 2021
Thanks. Abby! (I love a good comment spam — not quite sure what they get out of it…)
Daniel ALLSTARSIT October 12th, 2021
I agree! The comment section was quite entertaining and I’m definitely going to be bookmarking this for my current and future projects!