A data-driven argument to focus your efforts at ongoing improvement around one content metric.
<< tl;dr – The fastest route to content marketing success? Track a social share KPI on blog or social content, and run bold experiments to improve it. There’s no better way to lift more crucial and strategic downstream metrics like conversions and sales. >>
There are two approaches to data: The scientist, and the trainspotter.
To scientists, data is a means to ensure new theories are anchored in reality.
To trainspotters, data is an end.
To stay on the right side of that divide, content marketers need to track only data that validates hypotheses that contribute to business results.
This post resulted from an investigation to define the leanest possible approach to measuring content marketing performance.
A content marketing organization will need to relate to three broad categories of data, each with a corresponding period or duration (Jay Baer made a nice model involving four, but I think these three might be more in tune with a content marketing organization’s structure and priorities):
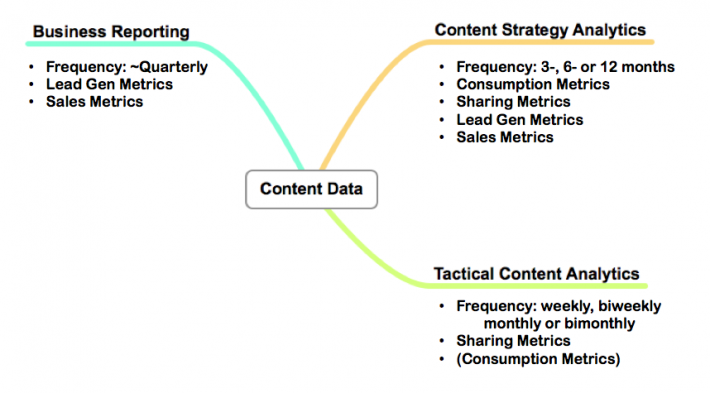
True to its title and the lean approach, I’ll be focusing in on the most critical data, and only the absolutely necessary data. Research and analysis suggests that acting on one kind of data will have the greatest impact on a marketing program in the short- and long-term:
Social sharing data from your awareness content during tactical content analytics (for our purposes, consider awareness content as blog content or content published to a community such as Slideshare, YouTube or Facebook)
I’ll tell you why this is the case, how you can get the data and how you can use it to improve your content marketing.
It’s all about continuous improvement & little bets
Of one thing you can be certain in content marketing: Your first efforts will almost definitely be your worst. And your current efforts will be eclipsed by later efforts. Everyone improves. What sets great programs apart from mediocre ones: the rate of improvement.
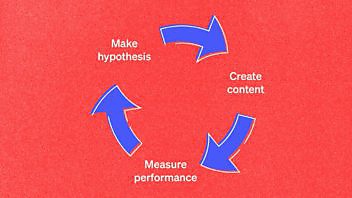
See improvement as a cycle:
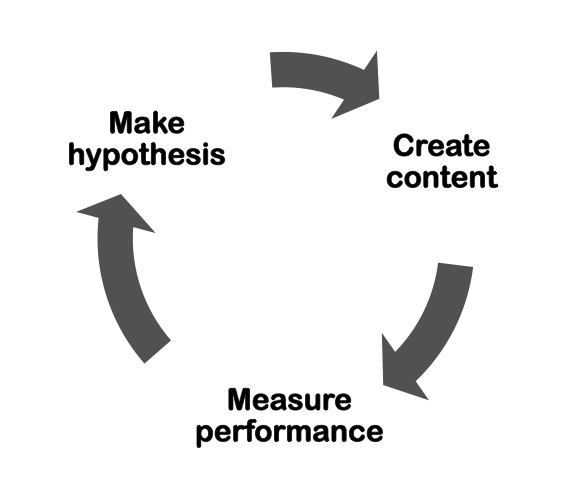
Most B2B businesses doing content marketing have two connected cycles – one for their awareness content, and another for lead-gen. I think we can agree that improvement of the latter (new prospects into and through our sales funnel) is more important. Somewhat counterintuitively, then, the more important cycle to measure and improve is the cycle for awareness content.
Here’s why: You want to improve as fast as possible, and you want to mitigate the risks to your most important results.
Here are how these two cycles of improvement relate to each other over time (as feedback loops):

Cycles for awareness content are much faster, and smaller stakes, thus – I argue – better fodder for improvement. Here’s the argument:
Better to make lots of little bets that lead to steady, validated improvement than the occasional big gamble (better for your career, and – actually – better in terms of the final result).
The faster the iterations, the quicker the improvement, and the higher the chances of success with the big cornerstone content lead-gen pieces.
So I conclude: The greatest impact will come from measuring and improving performing against our awareness content.
(To stanch any protests: Yes, you must measure conversions, which for most content marketers means lead-gen, and prospects’ progress through the funnel. But, in terms of overall, long-term impact – that is, the rate of improvement in performance – you’ll get the best results by focusing on your pre-funnel, or top-of-funnel, awareness content because it has a higher frequency. This will reflect itself in more rapid improvement in those downstream metrics, I argue).
Why sharing metrics are the key dial for your awareness content
The guy who wrote the book on web analytics (no, really) recently shared an excellent post on lean analytics, and how it applies to websites.
In it, he pointed out that all business measurement must follow a four-step path: Metrics > Hypothesis > Experiment > Act. Further, in order to make an experiment, you need to identify the target audience whose behavior you want to test.
Everything happens because someone does something. So who are you expecting to do a thing?…Until you know whose behavior you’re trying to change, you can’t appeal to them.
AND
What do you want them to do?
What are the answers to these questions if our area of study is awareness content, and our goal is to get it seen by as many relevant website visitors as possible?
We cannot study the entire population of potential relevant website visitors because, per definition, we aren’t reaching them and have no way to get them to do something.
We can, however, study the people who are already coming to our site, and the most relevant action to measure is how, and how much, they share the content.
This sketch illustrates the fundamental dynamic:
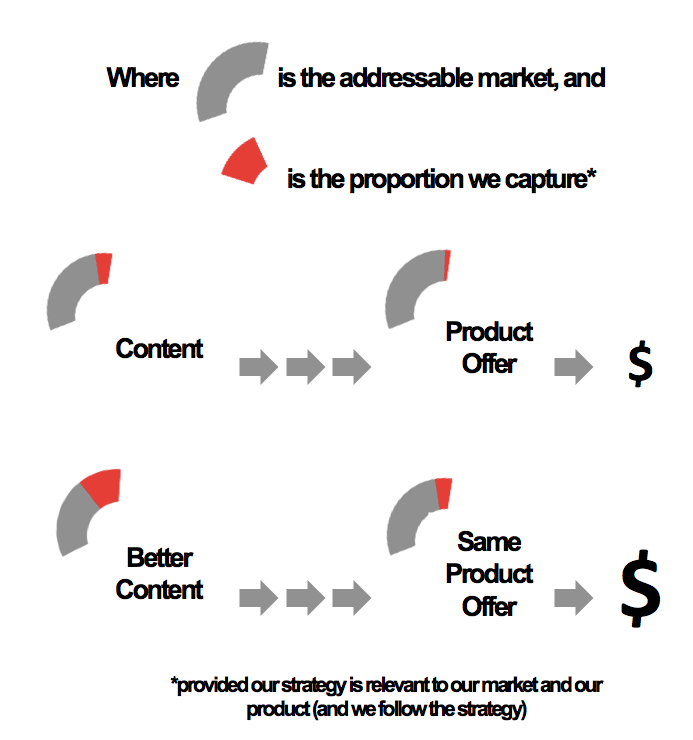
Our goal is to use data about the proportion of the market we’re capturing to get to better content (and thus capture more of our market, and sell more product).
Analyzing the sources of the market we capture with our content gives us:
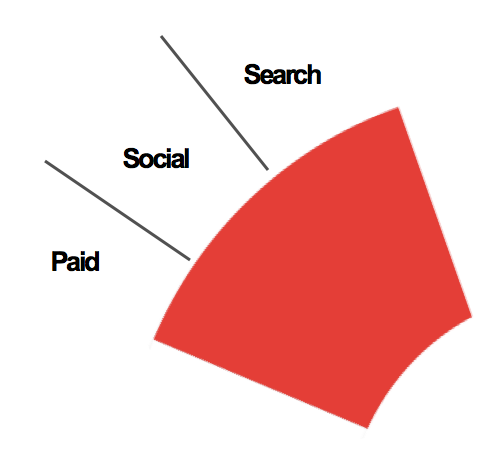
Who are we hoping to get to do something? “Search engines” isn’t a valid answer; they’re run by people, but they’re not people. The paid channel – people we give money – isn’t a group of people we want to do something.
No, the only channel we can influence to do something is the social channel. It spills over into search as search engines use social validation and earned backlinks as a signal, but that’s a secondary effect.
To use Avinash’s framework:
Find out if WHO will do WHAT because WHY enough to improve KPI by the Target we’ve defined.
We get:
Find out if people who read/consume post Z will share it because they like it enough to increase the level of shares compared to previous posts by X%.
In our tactical mind-set, we’re going to assume that increased sharing automatically leads to more leads. We can qualify that when we do a strategic review at, say, 3 to 6-month intervals.
This focus on social metrics has anecdotal support from no other than Ann Handley, who was recently quoted in Lee Odden’s Top Rank Blog thus:
“Finding has been around for a long time – in the age of Google, you can expect that people will search for your business online. But as social platforms expand and adoption increases, sharing is far more prevalent AND important. That’s the secret to successful content, too: Creating content worth sharing, because increasingly social networks recommendations are as powerful (actually, more so) than Google results.”
Arriving at our social data experiment
Once we’re determined to use social as our key metric, we’d want to find a baseline level of social shares for our awareness content, then establish two or three new experimental directions in our content (format, story, etc.) and measure these posts’ uplift in terms of sharing, like this:
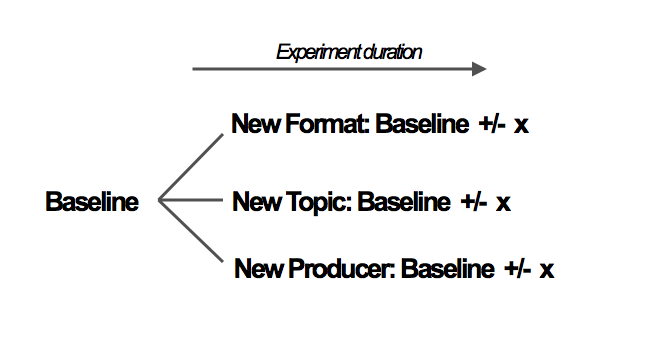
How would you arrive at a baseline? In effect, what would you be measuring, and when would you capture the new baselines?
I’d build the baseline from ten or more recent and representative pieces of awareness content (blog content, facebook posts, Slideshare decks, etc). The data to capture would be the major share figures:
- Twitter shares
- LinkedIn shares
- Facebook likes/shares
- Google+ +1’s
- Pinterest pins
- Stumbles
Further, you would want to track new backlinks to your content. Then you’d want to multiply each of these by some coefficient that relates the value of that network to you; the conversions percentage of traffic from each source would make a lot of sense.
However, as this quickly becomes a huge data collection burden, it’d probably be worthwhile to use only one or two of your most important networks as a proxy.
With any luck, you’d have one reference point that looked like this (using 0.8 and 1.2 as our value coefficients for Twitter and LinkedIn respectively, as examples):
(0.8 * all Twitter shares + 1.2 * all LinkedIn shares) / 10 = Baseline
You can use Ryp Marketing’s Blog Social Analyzer to grab share data on your 10 most recent blog posts in a heartbeat. Run the experiment over the minimum amount of time (as quickly as a week, depending on your publishing frequency), then grab the same data for your experimental content.
Obviously, social sharing occurs with some time-lag. We find that our posts usually get roughly 70 to 80% of all the shares they’re going to get during their first three days. So you may want to multiply the shares of very recent experimental posts by 1.2 or 1.3.
Then, compare against your baseline.
I’m going to argue that you shouldn’t make any significant tactical changes unless you see an uplift of at least 50% (and, better yet, 100%); the point of this exercise is to hunt for and arrive at impact, as fast as possible.
Obviously, though, what you see as a significant improvement depends on your existing performance, how long you’ve been doing this and your history of running experiments.
Examples
Two beautiful aspects of this form of analysis:
- You’re assessing public data, so you can also run tests on your peers’ and competitors’ content (what’s working for them?)
- It’s timeless, so you can build experiments as far back as you have reliable social share data (just build your baseline wisely)
What this means: You can build experiments around any category of content from any category of site, and learn what works, and for whom.
To demonstrate, I ran two experiments – one with content from Econsultancy’s blog and one with content from our own blog.
The Econsultancy experiment compared Econsultancy editor Graham Charlton’s recent Google Analytics posts against a baseline of 10 random posts published around the same time. You can find all the data here, but the results speak strongly (by proportion):
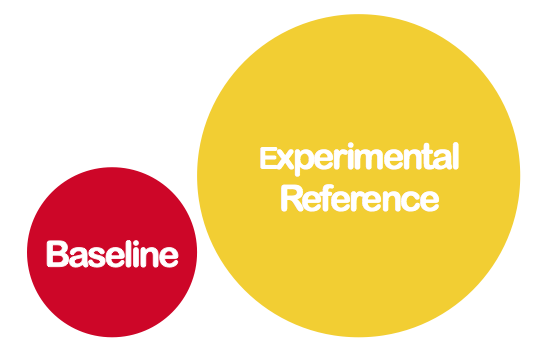
Charlton’s posts were 370% of baseline, based on the above formula I created for weighted social shares. Conclusion: Charlton and Econsultancy should double-down on these kinds of posts. [See the data].
Now this probably does not come as a surprise to them, and they can probably see a similar result from pageview data. This is more telling, however, and – if they wanted to drill a little deeper – contacting some of the individuals who shared the post would add a layer of meaning to their content strategy.
Compare this to a study of our own blog. We compared four posts with book or content marketing software reviews, with a baseline for our own blog. These were the results:
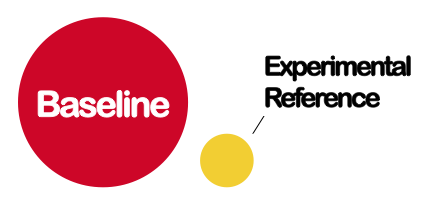
Our review posts were ~10% of baseline. Conclusion: Our audience doesn’t find our reviews (thus far) worth sharing with their networks. [See the data]
What gets really interesting is when we compare this result with the same study on pageviews only, which yielded this result:
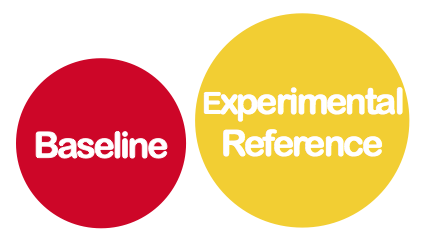
Our review posts yielded, on average, 164% higher baseline pageviews. We can tentatively conclude that Google liked these posts – at least, one of them – much more than readers (at least, based on their willingness to share the posts). [See the data].
The social metrics would argue strongly against doing more review posts; the pageview data argues weakly for them. The question: Which new traffic’s more important to our goals – new traffic from search engines, or new traffic from the social networks of our website visitors? Run your own data for conversions by medium (first-time visitors only) and draw your conclusions.
What kinds of experiments should you run?
It’ll depend a bit on your content strategy, but I’d advise you to be bold. Getting to 50% or more uplift in sharing data requires some ambition. Typical areas where you can start varying is in format (data-driven post, an essay packed with opinions, an explanatory deck, a survey of online resources, etc.), in producer (who’s making the content) or topic.
Some valuable references for content marketing analytics
Enjoyed this article?
Take part in the discussion



Comments
There are no comments yet for this post. Why not be the first?